
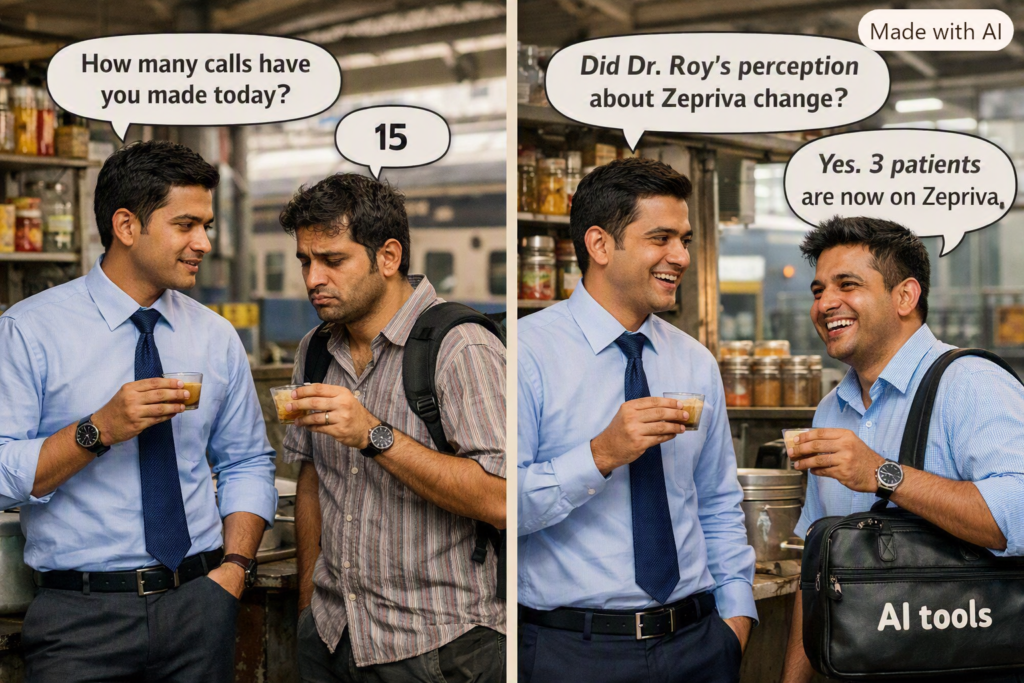
Measuring Sales Impact Beyond Activity – Brand Management 153
Lead Author – Shailaja Dwivedi Pathak, with Vivek Hattangadi
If a Medical Representative makes twelve calls today, what have we actually achieved?
Most pharma dashboards still focus on activity. They track calls made, doctors covered, calls per day, samples and gifts given, visual aids used, digital interactions, CRM entries, and retailer visits.
These numbers are useful, but they do not tell us the outcome.
There is a real risk in sales management. We may measure activity only because it is easy to measure. A perfect call average does not mean perfect sales effectiveness.
The real question is different.
Did the activity change anything?
Did the doctor understand the message?
Did the doctor’s perception shift?
Did the doctor engage more? Did prescribing behaviour move?
Did the brand gain share?
Did the territory grow?
Did the return on sales‑force investment improve?
This is the shift from activity analytics to impact analytics.
Instead of saying, “My representative visited one hundred and fifty doctors,” we should ask, “What changed for those one hundred and fifty doctors after the interaction?”
Technology now allows this.
We can connect call activity, prescription data, doctor potential, digital engagement, samples, sales, market share, and even inventory.
When these streams come together, we can see the link between effort and outcome.
The dashboard of the future will not stop at “Calls = 92 percent.”
It will show incremental prescriptions generated, high‑potential doctors converted, sales generated per call, and return on investment per territory. This changes how the entire organisation behaves.
A useful Indian example is Sun Pharmaceutical Industries.
Sun Pharma publicly tracks sales per medical representative, not just the size of its field force.
Its FY25 report shows 15109 representatives and sales of about Rs. 11.2 million rupees per representative. The company calls this field‑force productivity. This is a strong managerial idea.
If Company A has ten thousand representatives and Company B has fifteen thousand, the larger force tells us very little. But asking how much business each representative generates shifts the focus from force size to force productivity.
You can take this further. Sales per representative is only the starting point. The next step is measuring incremental sales generated per meaningful customer interaction. That is a far stronger metric.
You can offer the audience a simple framework:
Activity → Engagement → Behaviour → Prescription → Sales → Profit
If your dashboard stops at activity, you are measuring effort. If it reaches sales and profit, you are measuring impact.